nohup이란

리눅스, 유닉스에서 쉘스크립트파일 (*.sh)을 데몬형태로 실행시키는 프로그램

터미널 세션이 끊겨도 실행을 멈추지 않고 동작하도록 함

&이란?

프로세스를 실행할 때 백그라운드에서 동작하도록 만드는 명령어

nohup streamlit run app.py & 를 입력하면 터미널 연결이 끊겨도 백그라운드로 계속 돌아간다.

1. visual studio에서 수정하고 저장한다. M 이 나오면 수정되었다는 것이다.

2. 로컬 환경에서 테스트 해본다.

3. commit 한다.

4. push 한다.

5. putty로 ssh연결한다.

6. 클론이 있는 디렉토리로 이동해서 git pull을 입력한다.


1번은 명령어만 쳐서 git을 설치하면된다.

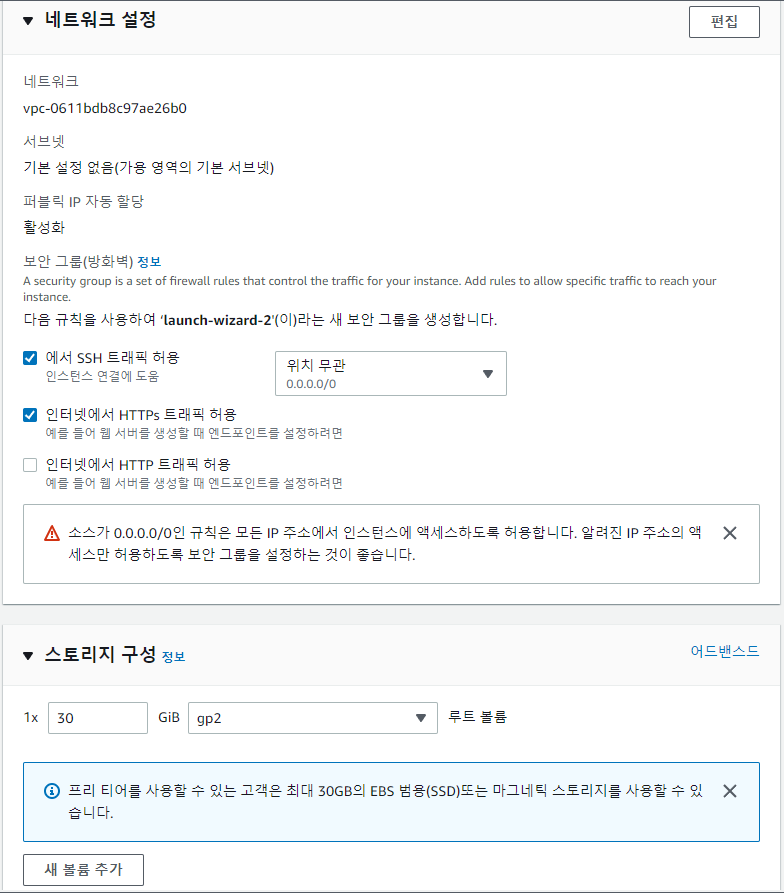
2번은 만들 때 https허용을 해줬다. https의 포트번호가 443이다.

3번은 code를 누르고 https 복사해주고 git clone 주소 명령어를 입력해준다.

이러면 클론이 만들어진거다. ls를 입력했을때 클론 파일인 streamlit-car-price-app이 나온다.

https://www.anaconda.com/products/distribution


Anaconda | Anaconda Distribution

Anaconda's open-source Distribution is the easiest way to perform Python/R data science and machine learning on a single machine.

www.anaconda.com

위 링크에 들어가서 아래 리눅스 이미지를 누른다.

맨위 64비트 x86에 마우스 오른쪽 클릭 링크 주소 복사를 한다.

wget 링크주소 명령어를 입력하고

sh 아나콘다파일 을 입력한다. tap을 누르면 자동완성 된다.

conda create -n 가상환경이름 python=3.7 numpy scipy matplotlib ipython scikit-learn pandas pillow jupyter seaborn

으로 설치한다. pip install streamlit으로 설치한다.

conda activate 가상환경이름 을 치면 아래 처럼 나온다.

ssh 트래픽허용을 해줘야 putty로 연결할 수 있다.

https://www.putty.org/


Download PuTTY - a free SSH and telnet client for Windows

Is Bitvise affiliated with PuTTY? Bitvise is not affiliated with PuTTY. We develop our SSH Server for Windows, which is compatible with PuTTY. Many PuTTY users are therefore our users as well. From time to time, they need to find the PuTTY download link. W

www.putty.org

위에서 putty를 다운받고 설치해준다.

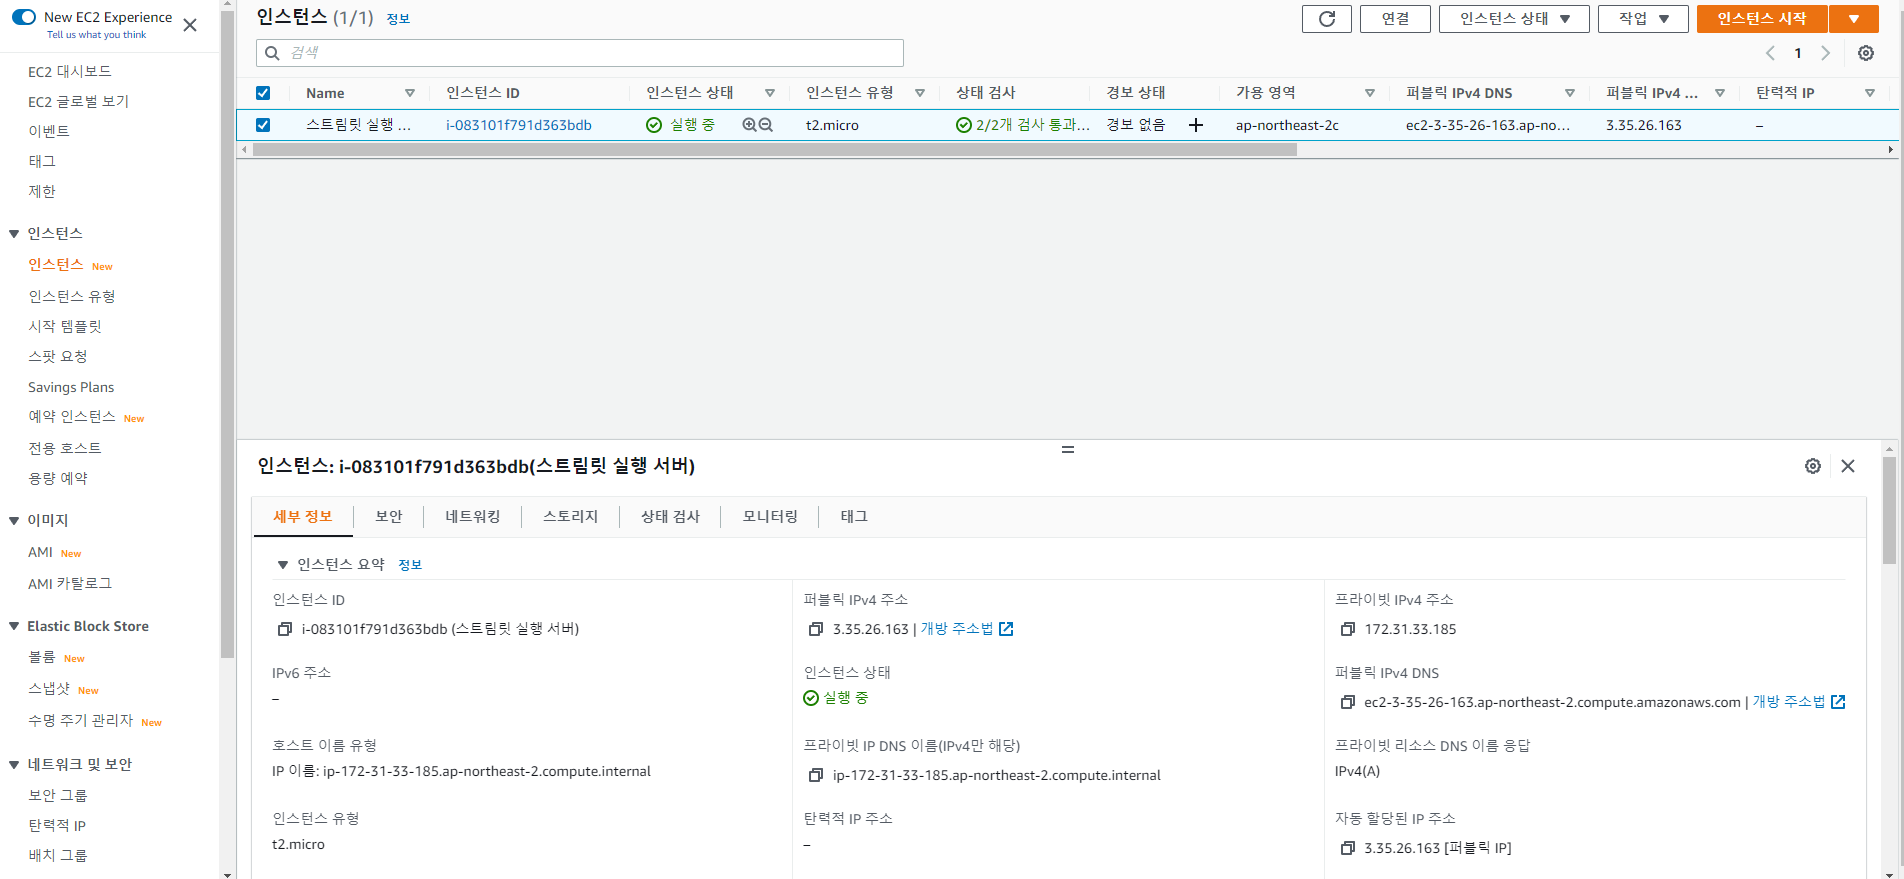
Host Name에 아래 퍼블릭 IPv4주소를 복사해 넣고 Port에 22 connection type에 ssh넣는다.

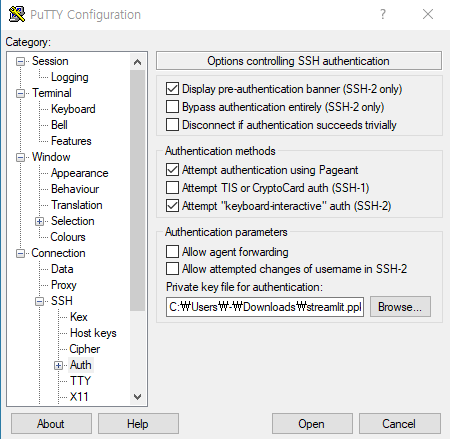
이제 ppk파일을 넣어줘야 한다.

키 페어 생성때 다운로드  받아진 ppk파일을 넣고 session창에서 saved session에 저장해준다.

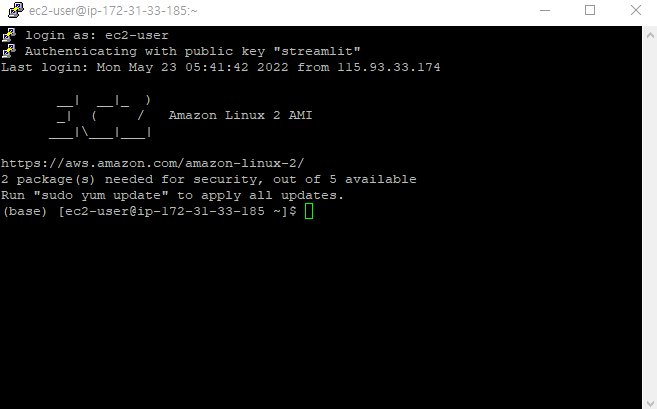
open을 누르면 열리고 

로그인하면 된다.

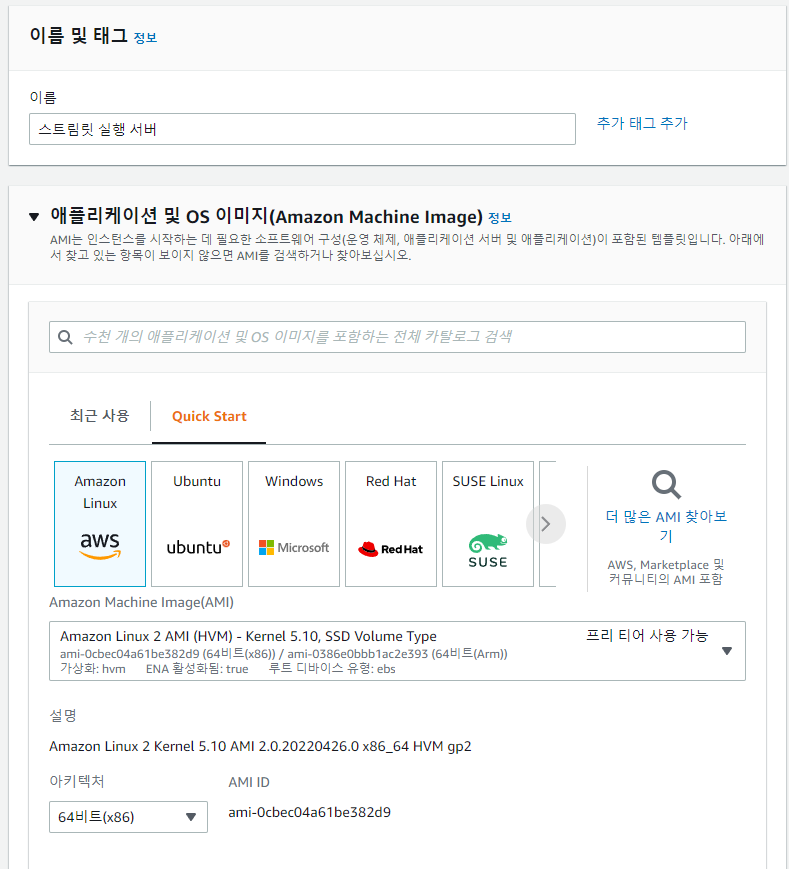
서버 이름과 os를 정해준다.

프리티어 인스턴스를 정하고, 키페어를 설정한다.

키페어를 갖고 있어야 서버에 접근할 수 있다. 

이름을 적어주고 rsa ppk 체크한다. 윈도우 에서는 putty와 함께 ppk파일을 쓴다.

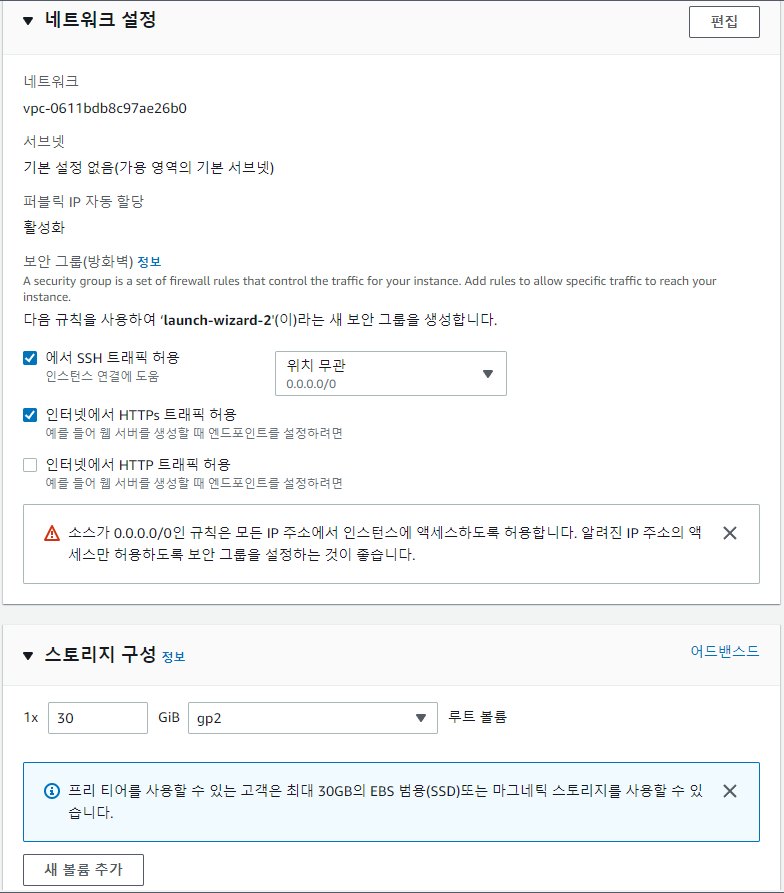
ssh 허용과 https트래픽 허용을 체크후 스토리지 구성을 맞춰준다. ssh는 putty에서 연결 https는 깃허브와 연결할 거다.


import joblib
joblib.dump(regressor, 'regressor.pkl')
joblib.dump(scaler_X, 'scaler_X.pkl')
joblib.dump(scaler_y, 'scaler_y.pkl')

joblib을 통해 인공지능 모델 regressor와 x의 스케일러 scaler_X y의 스케일러 scaler_y를 pickle로 저장한다.

regressor = joblib.load('data/regressor.pkl')
scaler_X = joblib.load('data/scaler_X.pkl')
scaler_y = joblib.load('data/scaler_y.pkl')

그후 streamlit이 작동되는 환경에서 폴더에 pickle파일들을 넣고 load한다. 이제 scaler_X로 새로운 데이터 전처리를 한후 regressor모델에 대입하고 scaler_y.inverse_transform함수로 예측값을 뽑아낸다.

1. 주피터 노트북에서 탐색적 데이터 분석을 마친다.

2. 코랩같은 클라우드 환경에서 인공지능 모델링과 학습을 해준다.

3. 인공지능 모델을 pickle로 다운로드 받아서 로컬환경에서 streamlit 라이브러리로 ui와 함께 Data Dashboard App을 만든다.

4. 로컬에서 잘 작동하는지 확인 했다면, aws ec2에 업로드 한다.

먼저 메인 파이썬 파일을 만들어 준다.

## 파일을 분리해서 만드는 앱 ###

import streamlit as st
from app9_about import run_about
from app9_eda import run_eda

from app9_home import run_home
from app9_ml import run_ml

def main():
    st.title('파일 분리 앱')

    menu = ['Home', 'EDA', 'ML', 'About']

    choice = st.sidebar.selectbox('메뉴', menu)

    if choice == menu[0]:
        run_home()
    elif choice == menu[1]:
        run_eda()
    elif choice == menu[2]:
        run_ml()
    elif choice == menu[3]:
        run_about()

if __name__ == '__main__':
    main()

그리고 from 모듈 import 함수로 다른 파일에 있는 함수를 불러온다.

아래는 app9_home파일이다.

import streamlit as st
from PIL import Image

def run_home():
    st.subheader('홈 화면입니다.')

    st.text('파일 분리 앱 실습하는 중')

    img = Image.open('data2/image_03.jpg')

    st.image(img)


import streamlit as st
import pandas as pd
import matplotlib.pyplot as plt
import seaborn as sns

def main():
    st.title('차트 그리기 1')

    df = pd.read_csv('data2/iris.csv')

    st.dataframe(df)

    # 차트 그리기
    # sepal_length 와 sepal_width 의 관계를
    # 차트로 나타내시오.

    fig = plt.figure()
    plt.scatter(data = df, x = 'sepal_length', y = 'sepal_width')
    plt.title('Sepal Length vs Width')
    plt.xlabel('Sepal Length')
    plt.ylabel('Sepal Width')
    st.pyplot(fig)

    fig2 = plt.figure()
    sns.scatterplot(data = df, x = 'sepal_length', y = 'sepal_width')
    plt.title('Sepal Length vs Width')
    st.pyplot(fig2)

    fig3 = plt.figure()
    sns.regplot(data = df, x = 'sepal_length', y = 'sepal_width')
    st.pyplot(fig3)

    # sepal_length 로 히스토그램을 그린다.
    # bin 의 갯수는 20개로.

    fig4 = plt.figure()
    plt.hist(data = df, x = 'sepal_length', bins = 20, rwidth = 0.8)
    st.pyplot(fig4)

    # sepal_length 히스토그램을 그리되,
    # bin 의 갯수를 10개와 20개로 
    # 두개의 차트를 수평으로 보여주기

    fig5 = plt.figure(figsize = (10,4))
    plt.subplot(1, 2, 1)
    plt.hist(data = df, x = 'sepal_length', bins = 10, rwidth = 0.8)

    plt.subplot(1, 2, 2)
    plt.hist(data = df, x = 'sepal_length', bins = 20, rwidth = 0.8)

    st.pyplot(fig5)

    # species 컬럼의 데이터를 각각 몇개씩 있는지
    # 차트로 나타내시오.

    fig6 = plt.figure()
    sns.countplot(data = df, x = 'species')
    st.pyplot(fig6)

    #### 지금까지 한건, plt와 seanborn 차트를
    # streamlit에 그리는 방법했다.

    #### 데이터프레임이 제공하는 차트함수도
    # streamlit에 그릴 수 있다.

    # species 는 각각 몇개인지, 데이터프레임의
    # 차트로 그리는 방법
    
    fig7 = plt.figure()
    df['species'].value_counts().plot(kind = 'bar')
    st.pyplot(fig7)

    # sepal_length 컬럼을 히스토그램으로!
    fig8 = plt.figure()
    df['sepal_length'].hist(bins = 40)
    st.pyplot(fig8)

if __name__ == '__main__':
    main()
import streamlit as st
import pandas as pd

import altair as alt
import plotly.express as px

def main():
    # 스트림릿에서 제공해주는 차트
    # line_chart, area_chart
    
    df1 = pd.read_csv('data2/lang_data.csv')
    st.dataframe(df1)

    lang_list = df1.columns[1:]

    choice_list = st.multiselect('언어를 선택해주세요.', lang_list)

    if len(choice_list) != 0:
        df_choice = df1[choice_list]

        st.dataframe(df_choice)

        # 스트림릿이 제공하는 line_chart
        st.line_chart(df_choice)

        # 스트림릿이 제공하는 area_chart
        st.area_chart(df_choice)

    df2 = pd.read_csv('data2/iris.csv')

    # 스트림릿이 제공하는 bar_chart
    st.bar_chart(df2.iloc[:, 0: -2 + 1])

    ## 웹에서 사용할 수 있는 차트 라이브러리 중
    ## Altair 차트

    alt_chart = alt.Chart(df2).mark_circle().encode(x = 'petal_length', y = 'petal_width', color = 'species')
    st.altair_chart(alt_chart)

    ## 스트림릿의 map 차트
    df3 = pd.read_csv('data2/location.csv', index_col = 0)
    st.dataframe(df3)

    st.map(df3)

    # plotly 라이브러리를 이용한 차트 그리기.

    df4 = pd.read_csv('data2/prog_languages_data.csv', index_col = 0)
    st.dataframe(df4)

    # plotly 의 pie 차트
    fig1 = px.pie(df4, names = 'lang', values = 'Sum', title = '각 언어별 파이차트') 
    st.plotly_chart(fig1)

    # plotly 의 bar 차트

    df4_sorted = df4.sort_values('Sum', ascending = False)

    fig2 = px.bar(df4_sorted, x = 'lang', y = 'Sum')
 
    st.plotly_chart(fig2)
  
if __name__ == '__main__':
    main()

+ Recent posts